
Hello Viewers Today’s We are going to Share With You, The Complete Syllabus of AHSEC Class 12 Education Chapter 7 Educational Statistics Question Answer in English Medium. Are you a Student of AHSEC (Assam Higher Secondary Education Council). Class 12 Education Chapter 7 Educational Statistics Which you can Download PDF Notes. Class 12 Education Chapter 7 Educational Statistics Solutions for free using direct Download Link Given Below in This Post.


Class 12 Education Chapter 7 Educational Statistics
Today’s We have Shared in This Post, AHSEC Class 12 Education Guide for Free. Class 12 Education Notes in English. I Hope, you Liked The information About The Class 12th Education Question Answer in English Medium. if you liked AHSEC Solutions for Class 12th Education Then Please Do Share this Post With your Friends as Well.
Educational Statistics
| A. QUESTIONS FOR 1 MARK EACH |
(a) Fill in the blanks:
1. ____________ is the measure of central tendency which occurs most frequently.
Ans: Mode.
2. In a histogram class intervals are plotted on ____________ axis.
Ans: Ox.
3. In a histogram the scores within a given interval are represented by ____________ drawn on class intervals.
Ans: Seperate rectangle.
4. The interval between the highest and lowest score is called ____________.
Ans: Range.
5. ____________ is a bar graph with no gap in-between.
Ans: Histogram.
6. ____________ is essentially a line graph.
Ans: Frequency Polygon.
7. In assumed mean method AM is the ____________ of any class interval.
Ans: Midpoint.
8. The three most commonly used measures of central tendency are mean ____________ and mode.
Ans : Median.
9. 3 Mdn-2M = ____________.
Ans: Mode.
10. Mid value of the distance between the third and the first quartile is ____________.
Ans: Median.
11. Range is a measure of ____________.
Ans: Variability or dispersion.
12. Median is an score below which we can find ____________ % of score.
Ans: 50%
13. The extent of scatter of scores in the neighbourhood of the average is called ____________.
Ans: Variability.
14. The difference between the highest sore and lowest score of a frequency distribution is known as ____________.
Ans: Magnitude.
15. The score below which we can find out half of the scores is the ____________.
Ans: Median.
16. A histogram is a ____________.
Ans: Collumn diagram.
17. In a polygon frequencies are plotted on ____________.
Ans: Oy axis.
18. The mode of distribution is the value that has highest of ____________.
Ans: The mode of distribution is the value that has highest of series.
19. In a histogram the area of each rectangle is proportional to ____________.
Ans: In a histogram the area of each rectangle is proportional to the number of measures with the interval.
20. In a histogram, each class rectangles is constructed with base as ____________.
Ans: In a histogram, each class rectangles is contracted with base as frequencies.
21. M = “FX ÷ ____________.
Ans: N.
22. Q=Q₁- Q₃ ÷ ____________.
Ans: 2.
23. In histogram class intervals are taken along ____________.
Ans: X-axis.
24. ____________ is essentially a line graph.
Ans: Frequency polygon.
25. In a polygon the height and width proportion should be ____________ %.
Ans: 75.
(b) Write true or false:
26. Mean can be computed by inspecting the scores.
Ans: True.
27. Median is affected by the extreme values.
Ans: False.
28. Mode is not affected by range of the scores.
Ans: True.
29. Median is the mid value of a class interval.
Ans: True.
30. Polygon is a line graph.
Ans: True.
31. Central tendency is a representative value of the scores.
Ans: True.
32. It is possible to compute median from open-ended distribution.
Ans: True.
33. In a polygon frequencies are plotted on x-axis.
Ans: False.
34. Mean is the most reliable measure of central tendency.
Ans: True.
35. Quartile deviation is a measure of variability.
Ans: True.
36. We can compute statistics from statistics by statistics.
Ans: True.
37. Range is a measure of central tendency.
Ans: False.
38. Median is a measure of variability.
Ans: False.
39. The gap between highest score and lowest score is called range.
Ans: True.
40. Median is sensitive to the extreme values of the distribution.
Ans: False.
41. The first quartile (Q₁) is the score blow which lie 75% of the scores.
Ans: False.
42. Median and Mode can be determined graphically.
Ans: Median and mode cam be determined graphically False.
43. Quartile deviation is suitable for open-ended distribution.
Ans: Quartile deviation is suitable for open ended distribution-False.
44. Pie diagram is a circle broken down into component.
Ans: Pie diagram is a circle broken down into component – True.
| B. QUESTIONS FOR 2 MARK EACH |
1. What is frequency?
Ans: Frequency refers to the number times a particular value appears in a distribution. For example, in a distribution of values, 4, 5, 5, 6, 5, 4, the frequency of 5 is 3, that of 4 is 2 and that of 6 is 1.
2. What do you mean by class interval?
Ans: The size of the class interval is determined in view of the total number of values in a given distribution of data.
3. What are the representational graph?
Ans: It is a pictured representation of an event for which it bears reliability and objectivity. It can be done through frequency polygon, histogram, cumulative frequency graph and cumulative percentage curve or ogive.
4. Write the formula for finding out Median from grouped data?
Ans: Mdn = L+ [ N/2-F/fm] / xi
5. Why histogram is called continuous bar graph?
Ans: Histogram is called continuous bar graph because the frequency distribution the class interval uniformly.
6. What is a frequency distribution table?
Ans: Frequency distribution table: The table where the raw scores are systematically arranged may be known as ‘Frequency distribution table.’ In a frequency distribution table there are three columns that is class intervals, tally marks and frequencies. The range of the variable in a particular sub-range is called class-interval and the number of items in a class-interval is knows as class frequency. The distribution as class frequency over the class intervals is known as the frequency distribution of the variables.
7. What is pie diagram?
Ans: When a circle is subdivided into various sectors for representing different data it is called a Pie-diagram. To represent the data by a pie diagram we first draw a circle with any radius. The angle at the centre of the circle is of 360 degrees which represents the aggregate. It can be divided into a number of smaller angles whose degrees would be in proportion to the values of the components. The angle representing each item or sector may be calculated with the help of the following formula Angle of any sector = Value of the Sector × 360° / Total value Suppose, in a college there are 120 students in Arts and 60 students in science faculty. If the values are represented by a pie-diagram the angle for Arts students will be 120 x 360° / 180 = 240° Similary the angle for the science students will be 60 × 360° / 180 =120°.
8. What are the first quartile and third quartile?
Ans: Q₁ is the 25th percentile above on 25 percent below the median on half the distance between Q₃ and Q₁.
Q₃ is the 75th percentile or the third percentils.
9. Which measure of central tendency will be applicable-when greatest stability is wanted?
Ans: Mean.
10. What is meant by the central tendency of a group of obtained scores?
Ans. Quantitative data show a common characteristic to concentrate at certain values, usually somewhere in the centre of the distribution. So there is a typical value which can represent all the figures in a series. This value around which the values of a distribution tend to cluster is called a measure of central tendency.
Arithmetic Mean is an important measure of central tendency.
11. Given the following sets of score. Calculate the range for each set.
Set-I: 15, 12, 18, 22, 5, 27, 8, 35
Set-II: 45, 52, 33, 42, 23, 58, 70, 79, 56
Ans: Set-I: 35-5 = 30
Set-II: 79-23=56
12. Write two differences between polygon and histogram.
Ans: Histogram: The totality of all the rectangles drawn on horizontal line with areas proportional to the frequencies of the respective class intervals is called a histogram.
Frequency Polygon: The data collected and tabulated can be graphically represented with the help of frequency polygon. In order to draw a frequency polygon, a base line is first to be drawn. Let us assume that the base line is ‘X’. Then a perpendicular line named ‘Y’ be drawn on the left. Then let us put the mind-points of the class-interval along line Y. We will get the frequency polygon by joining the points.
13. Write two merits of mean.
Ans: Merits:
(i) The definitaion of mean is clear and rigid.
(ii) It is simple to understand and easy to compute.
(iii) In the calculation of mean all the items of the series are taken into consideration.
(iv) It can be calculated even it the total and the number of item are given.
(v) It can be subjected to further algebric treatment.
14. Write two demerits of median.
Ans: Demerits:
(i) Rearrangement of data maybe necessary to compute the median.
(ii) For continuous series calculation of median is tedious.
(iii) Median does not have mathematical properties.
(iv) It does not take into account all the items of the series. So it is not true representative of the values of a variable.
15. Which is the most unstable central tendency?
Ans: Mode is the most unstable central tendency.
16. Which is the positional measure of central tendency?
Ans: Median is the positional measure of central tendency.
17. Which measure of Central tendency affected most by extreme observation?
Ans: The measure of central tendency affected most by extreme observation is median.
18. From a batch of 13 students who had appeared for an examination 4 students had failed. The marks of the successful students were – 41, 57, 38, 61, 35, 39, 75, 50, 45. Calculate the Median.
Ans: The formula of median is
Mdn = (N+1/2)th term = (9+1/2)th term = (10/2)th term = 5th term
If the marks of the successful students are arranged in an ascending order, 35, 38, 39, 41, 45, 50, 57, 61, 75
Mdn = 5th term = 45
Mdn = 45
19. In a histogram the class intervals are taken along – X-Axis/Y-Axis.
Ans: In a histogram the class intervals are taken along x-Axis (x Axis/y-Axis)
20. Given Mean is 25, Mode is 24, the Median would be ____________.
Ans: Given Mean is 25, Mode is 24, the median would be 24.6
[Mode (3Mdn – 2m)]
⇒ 24 = (3 × Mdn – 2 × 25) ⇒ 24 = 3Mdn – 50
⇒ 3Mdn – 50 = 24 ⇒ 3Mdn = 24 + 50 ⇒ Mdn = 24 + 50/3 = 73/3 =24.6
21. The mean of five numbers is 27. If one number is excluded, their mean is 25. Find the excluded number.
Ans: The excluded number is 125[M = Σx/N ⇒ 24 = Σx/ 5 ⇒ Σx = 125
22. Find the Median of the following data: 41, 43, 125, 99, 61, 92, 71, 58, 57. If 58 is replaced by 85. What will be the new median?
Ans: The given data are arranged in an ascending order,
41, 43, 57, 61, 71, 85, 97, 99, 125
∴ Mdn = (N+½)th term
= (9+½)th term = (10/2)th term = 5th term
Mdn 5th term = 71
The new median is 71.
23. Which is the most unstable central tendency?
Ans: Mode is the most unstable central tendency.
24. Which is the positional measure of central tendency?
Ans: Mean is the positional measure of central tendency.
25. Which measure of central tendency affected most by extreme observation?
Ans: Mean is the measure of central tendency affected most by extreme observation.
26. From a batch of 15 students who had appeared for an examination 5 students had failed. The marks of the successful students were 41, 58, 45, 63, 75, 62, 67, 54, 43, 72. Calculate the median.
Ans: The marks of the successful students were arranged in an ascending order- 41, 43, 45, 54, 58, 62, 63, 67, 72, 75
Here, n = 10
∴ Median = (n + 1/2)th term = (10 + 1/2)th term = (11/2)th term
= 5.5th term = Value of 5.5th term = (58 + 62/2) = (120/2) = 60
27. What is quartile deviation?
Ans: Quartile deviation or Q is one half of the difference between the 75th and 25th percentile in a frequency distribution.
28. Write the formula for determining range?
Ans: The formula for determining range is-
Range = (Highest score – Lowest score).
29. What is central tendency?
Ans: In most of the frequency distributions, the scores are concentrated near the centre of distribution. This tendency is referred to as the central tendency or average of the series.
| C. QUESTIONS FOR 3 MARK EACH |
1. What are the different measures of central tendency? Give example.
Ans: The different measures of central tendency are:
Mean: Mean is the best known and the most commonly used measure of central tendency. It is equal to the sum of all the scores divided by the total number of scores.
The formula used for calculating Mean by short method from grouped data is Mean = AM + Σfx’/N × i
Where AM = Assumed Mean
x’ = Deviation of x from the AM which is obtained by using x-AM/i
f = frequency in the class-intervals
N = Total frequency
i = Span of the class-interval.
Median: Median is defined as the point of the variable which divides distribution into two equal parts. The position of the median in a series is such that half of the scores are less and half of the scores are more than the median.
Mode: Mode is the value that occurs most frequently in a set of obser- vations. It is the point of maximum frequency around which other items of the set cluster densely. In a number of scores 4, 5, 5, 6, 7, 5, 6 mode is 5. Because 5 occurs the highest number of times.
2. Compute the means, median and mode for each of the following set of scores: (a) 9, 12, 5, 14, 18, 22, 27, 25, 22.
Ans: Mean: X = 9, 12, 5, 14, 18, 22, 27, 25, 22.
ΣX = 9 + 12 + 5 + 14 + 18 + 22 + 27 + 25+ 22 = 154.
M = Σx/N = 154/9 = 17.11
∴ M = 17.11
Median: Scores serially arranged 5, 9, 12, 14, 18, 22, 22, 25, 27
(N+1/2)th = (9+1/2)th = 10/2th = 5 score.
∴ Mdn 5th score = 18.
Mode: Scores = 9, 12, 5, 14, 18, 22, 27, 22, 25
MO = 22.
3. What do you understand by range? Give example.
Ans: Range is the difference between the highest and the lowest scores. It is not a satisfactory indicator of variability because it takes into account the extremes of the series only. It is unreliable when N is small or when many gaps (zero f’s) occur in the frequency distribution.
Consider the following series:
(a) 100, 40, 40, 20
(b) 80, 30, 50, 40
| Central tendency | Variability |
| Series (a) Mean = 50 | Range = 100 – 20 = 80 |
| Series (b) Mean = 50 | Range = 80 – 30 = 50 |
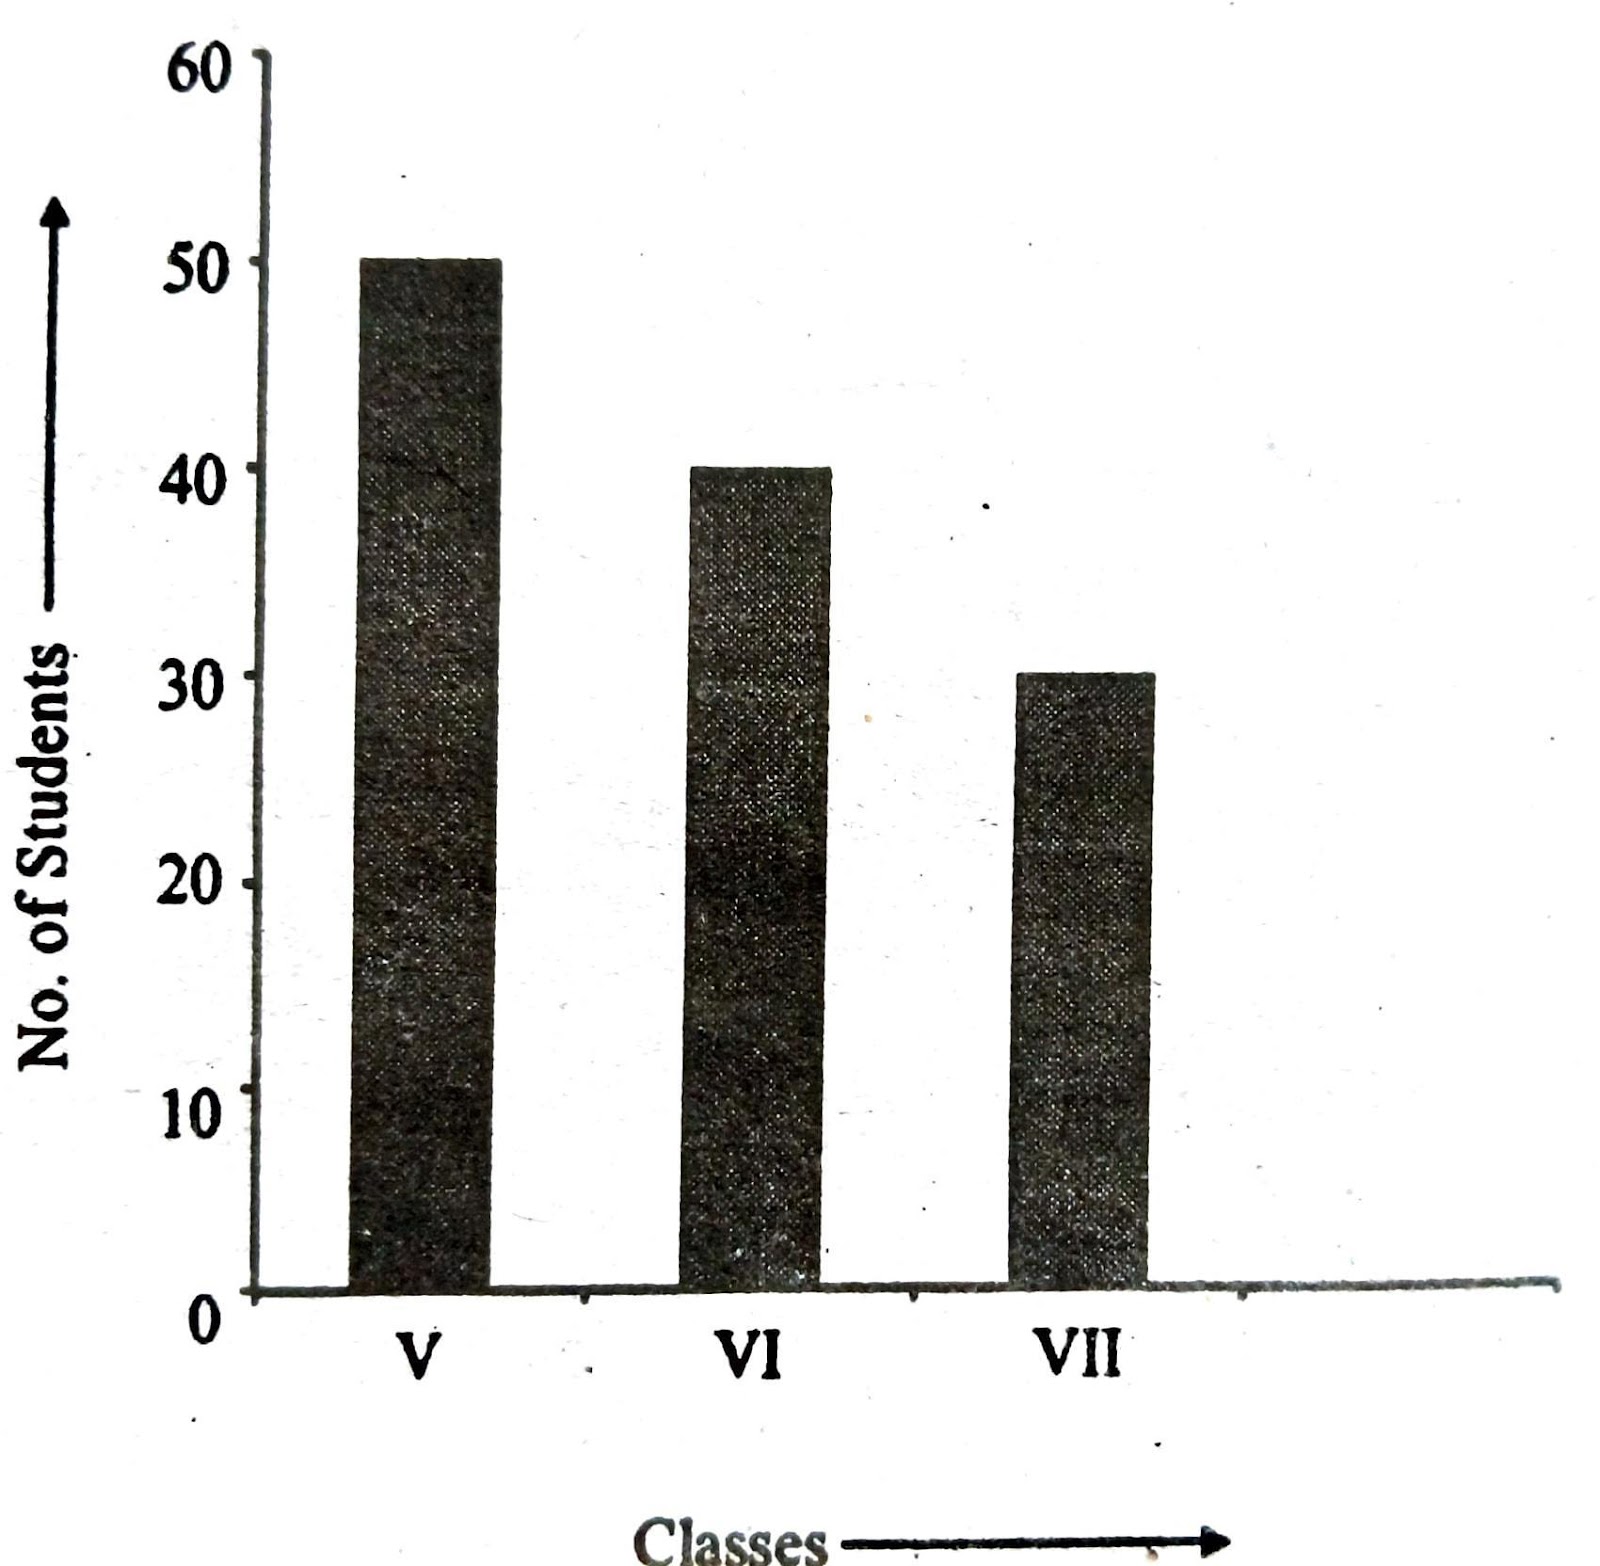
4. What is a bar diagram? What are its types?
Ans: When statistical data are represented by rectangular bars, the diagrams so drawn are called bar diagrams. They consist of a group of equidistant rectangles, one for each group or category of data in which the values are represented by the height of the rectangles.
Example: The number of students in three classes are as follows:
Class V – 50
Class VI – 40
Class VII – 30
We draw the following bar diagram based on the above data:
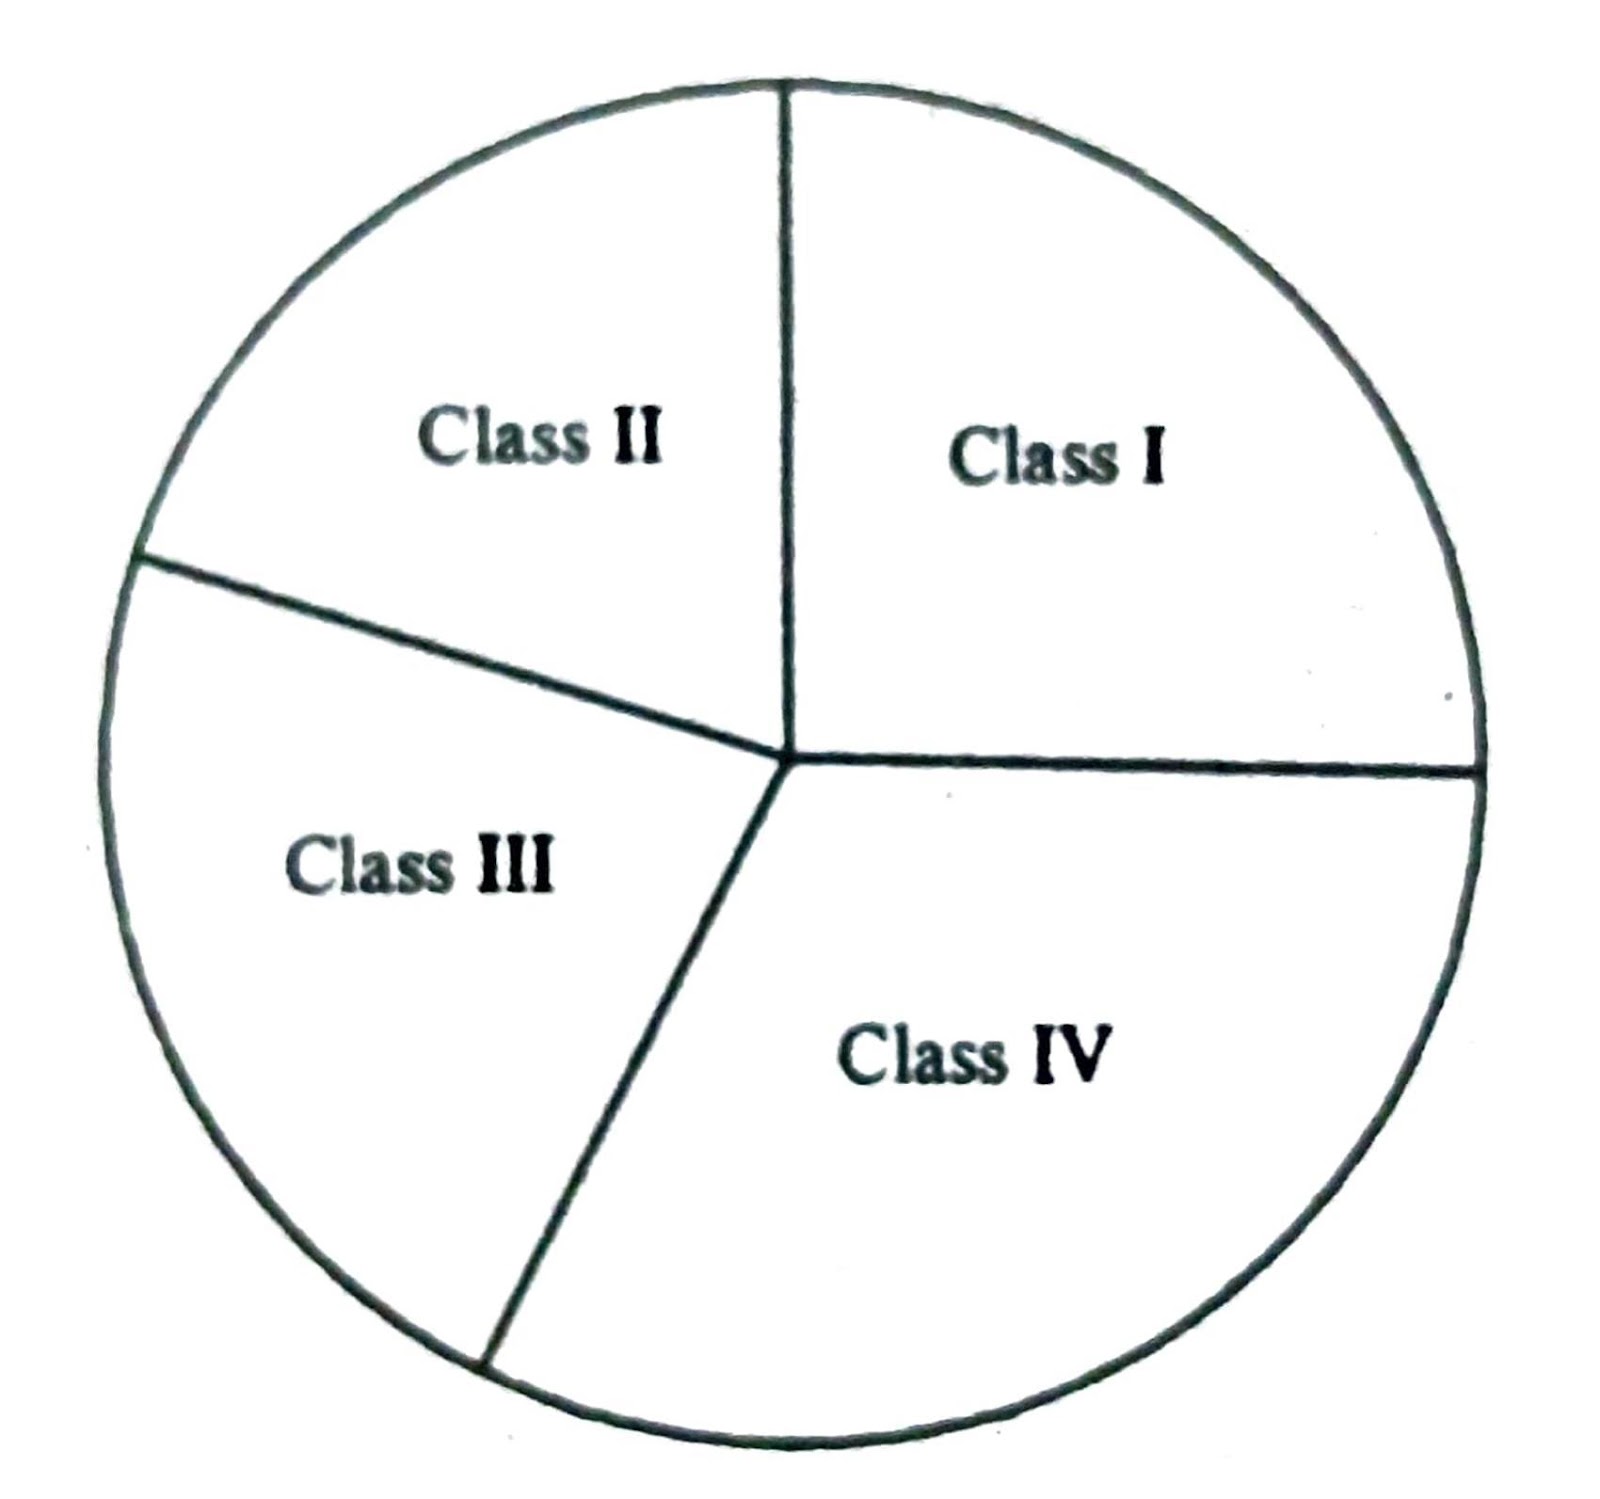
5. What is a pie diagram? Explain the procedure of making a pie diagram.
Ans: When a circle is subdivided into various sectors for representing different data it is called a Pie-diagram. To represent the data by a pie- diagram we first draw a circle with any radius. The angle at the centre of the circle is of 360 degrees which represents the aggregate. It can be divided into a number of smaller angles whose degrees would be in proportion to the values of the components. The angle representing each item or sector may be calculated with the help of the following formula Angle of any sector = Value of the Sector × 360°/Total value Suppose, in a college there are 120 students in Arts and 60 students in science faculty. If the values are represented by a pie-diagram the angle for Arts students will be 120 × 360° / 180 = 240° Similary the angle for the science students will be 60 × 360º / 180 = 120°.
6. Given Mean is 25, Mode is 27. Find out the median.
Ans: We have the formula-
Mode (3 Median – 2 Mean)
Here, M = 25 Mode = 27
∴ Mode = (3 Median – 2 Mean)
⇒ 27 = (3 Median – 2 × 25)
⇒ 27 = (3 Median – 50)
⇒ 3 Median = 27+50
⇒ Median = 77 / 3 = 25.67
∴ Median=25.67
7. Given Median is 45 and mode is 35. Find the Mean.
Ans: We have the formula-
Mode = (3 Median – 2 Mean)
Here, Median = 45
Mode = 35
∴ Mode = (3 Median – 2 Mean)
⇒ 35 = (3 × 45 – 2 Mean) ⇒ 35 = (135-2 Mean)
⇒ 135-2 Mean = 35 ⇒ – 2 Mean = 35 – 135 ⇒ 2 Mean = – 100
Mean = 100/2 = 50
∴ Mean = 50
8. What is statistics?
Ans: A science in which facts are collected in form of figures having a certain aim in mind is called statistics. The word ‘statistics’ is derived from the German word “Statsmer Kweidenkeiten” which means the remarkable things about the state such as population, land, area, tax collection by the state to have a distinct idea about what is going on the state.
| D. QUESTIONS FOR 4 MARK EACH |
1. Distinguished between histogram and polygon.
Ans: Histogram: The totality of all the rectangles drawn on horizontal line with areas proportional to the frequencies of the respective class intervals is called a histogram.
Frequency Polygon: The data collected and tabulated can be graphically represented with the help of frequency polygon. In order to draw a frequency polygon, a base line is first to be drawn. Let us assume that the base line is ‘X’. Then a perpendicular line named ‘Y’ be drawn on the left. Then let us put the mind-points of the class-interval along line Y. We will get the frequency polygon by joining the points.
2. What are the different parts of a frequency distribution table?
Ans: The different parts of a frequency distribution table are:
(i) Determination of Range: Range is the difference between the highest and the lowest scores. It is not a satisfactory indicator of variability because it takes into account the extremes of the series only. It is unreliable when N is small or when many gaps (zero f’s) occur in the frequency distribution. Consider the following series-
(a) 100, 40, 40, 20
(b) 80, 30, 50, 40
| Central tendency | Variability |
| Series (a) Mean = 50 | Range= 100-20 = 80 |
| Series (b) Mean = 50 | Range = 80-30 = 50 |
(ii) Size: For making the classification the size of the grouping is to be determind. Using 3, 4, 5, 10 units in lenfth may be taken and size of the class interval depending upon the range. The number of clas intervals may be determined by dividing the range by the grouping interval tentatively selected.
(iii) Tally: A tally represents a score that lies in any one particular class interval. One tally is given for each score opposite the corresponding class interval. The fifth tally is by the oblique line (IIII) over the previous four tallies.
(iv) Frequencies: Frequencies are represented in the 3rd column of the frequency distribution. When all the frequencies are added up, total number of cases of N is obtained.
(v) The midpoint of a interval in a frequency distribution: If all the scores are represnted within a given class-interval by some single the midpoint of the interval is the logical.
3. What do you understand by frequency distribution of statistical data?
Ans: Frequency distribution table: The table where the raw scores are systematically arranged may be known as ‘Frequency distribution table.’ In a frequency distribution table there are three columns that is class intervals, tally marks and frequencies. The range of the variable in a particular sub-range is called class-interval and the number of items in a class-interval is knows as class frequency. The distribution as class frequency over the class intervals is known as the frequency distribution of the variables.
In order to prepare a frequency distribution table, the following methodical steps must be followed:
(a) To identify the lowest and highest scores of the given number.
(b) Choose the magnitude of class intervals. Fix up the position of intervals.
(c) To give tally marks of the scores in the tally column of the respective class intervals.
(d) To place in figure the tally marks of the respective intervals to show the number of frequencies clearly.
The different parts of a frequency distribution table are:
(i) Size: For making the classification the size of the grouping is to be determind. Using 3, 4, 5, 10 units in lenfth may be taken and size of the class interval depending upon the range. The number of clas intervals may be determined by dividing the range by the grouping interval tentatively selected.
(ii) Tally: A tally represents a score that lies in any one particular class interval. One tally is given for each score opposite the corresponding class interval. The fifth tally is by the oblique line (IIII) over the previous four tallies.
(iii) Frequencies: Frequencies are represented in the 3rd column of the frequency distribution. When all the frequencies are added up, total number of cases of N is obtained.
(iv) The midpoint of a interval in a frequency distribution: If all the scores are represented within a given class-interval by some single the midpoint of the interval is the logical.
4. Explain how a frequency table is prepared, indicating the choice of the number of classes and the width of a class interval.
Ans. Frequency refers to the number times a particular value appears in a distribution. For example, in a distribution of values, 4, 5, 5, 6, 5, 4, the frequency of 5 is 3, that of 4 is 2 and that of 6 is 1.
5. Discuss the various methods of graphical representation of educational data.
Ans: The graphic representation of the frequency distribution can be done with the help of mainly four types of group.
They are:
(i) Freqneucy polygon: A frequency polygon is a figure representing the data on graph paper. The score values are measured along the x-axies and the frequencies along y axis. The axact limits of intervals are represented at regular distances along the base line from the origin and the frequencies against each interval are measured upon the y axies.
(ii) Histogram: It is an another means where the class interval is represented by a seperate rectangle. The area of each rectangle of histogram is directly proportional to of measures within the interval.
(iii) Bar diagram: When statistical data are represented by rectangular bars, the diagrams so drawn are called bar diagrams. They consist of a group of equidistant rectangles, one for each group or category of data in which the values are represented by the height of the rectangles.
(iv) Pie-diagram: When a circle is subdivided into various sectors for representing different data it is called a Pie-diagram. To represent the data by a pie-diagram we first draw a circle with any radius. The angle at the centre of the circle is of 360 degrees which represents the aggregate. It can be divided into a number of smaller angles whose degrees would be in proportion to the values of the components. The angle representing each item or sector may be calculated with the help of the following formula Angle of any sector = Value of the Sector × 360° / Total value Suppose, in a college there are 120 students in Arts and 60 students in science faculty. If the values are represented by a pie-diagram the angle for Arts students will be 120×360° / 180 = 240°
Similarly the angle for the science students will be 60×360º / 180 = 120°
6. Represent the following data of students enrollment in a primary school by bar diargram.
| Class | Boys | Girls |
| I | 24 | 16 |
| II | 20 | 12 |
| III | 20 | 14 |
| IV | 16 | 12 |
Ans:
| Class | Boys | Girls |
| I | 24 | 16 |
| II | 20 | 12 |
| III | 20 | 14 |
| IV | 16 | 12 |
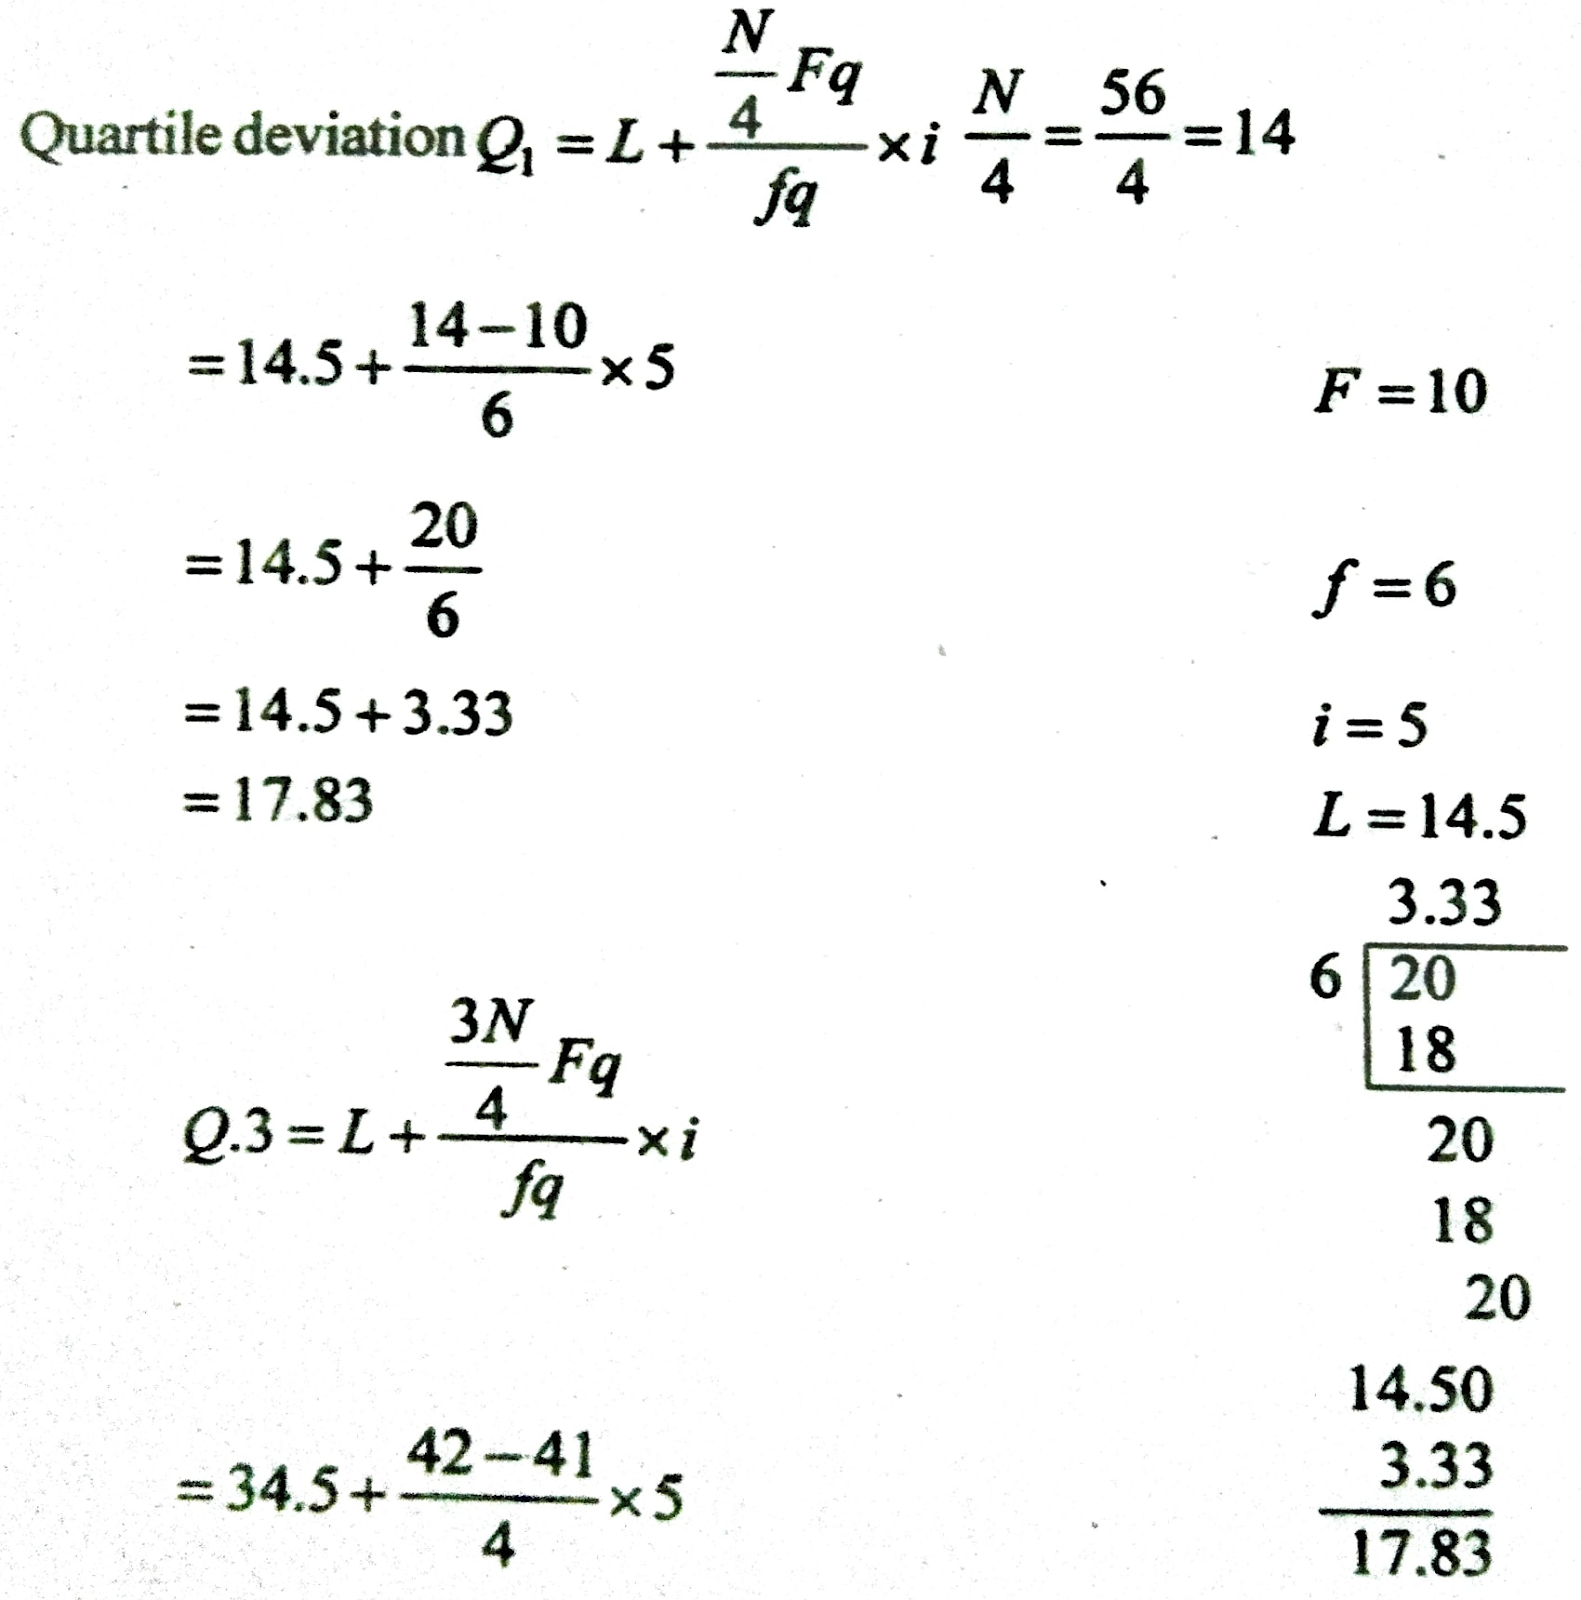
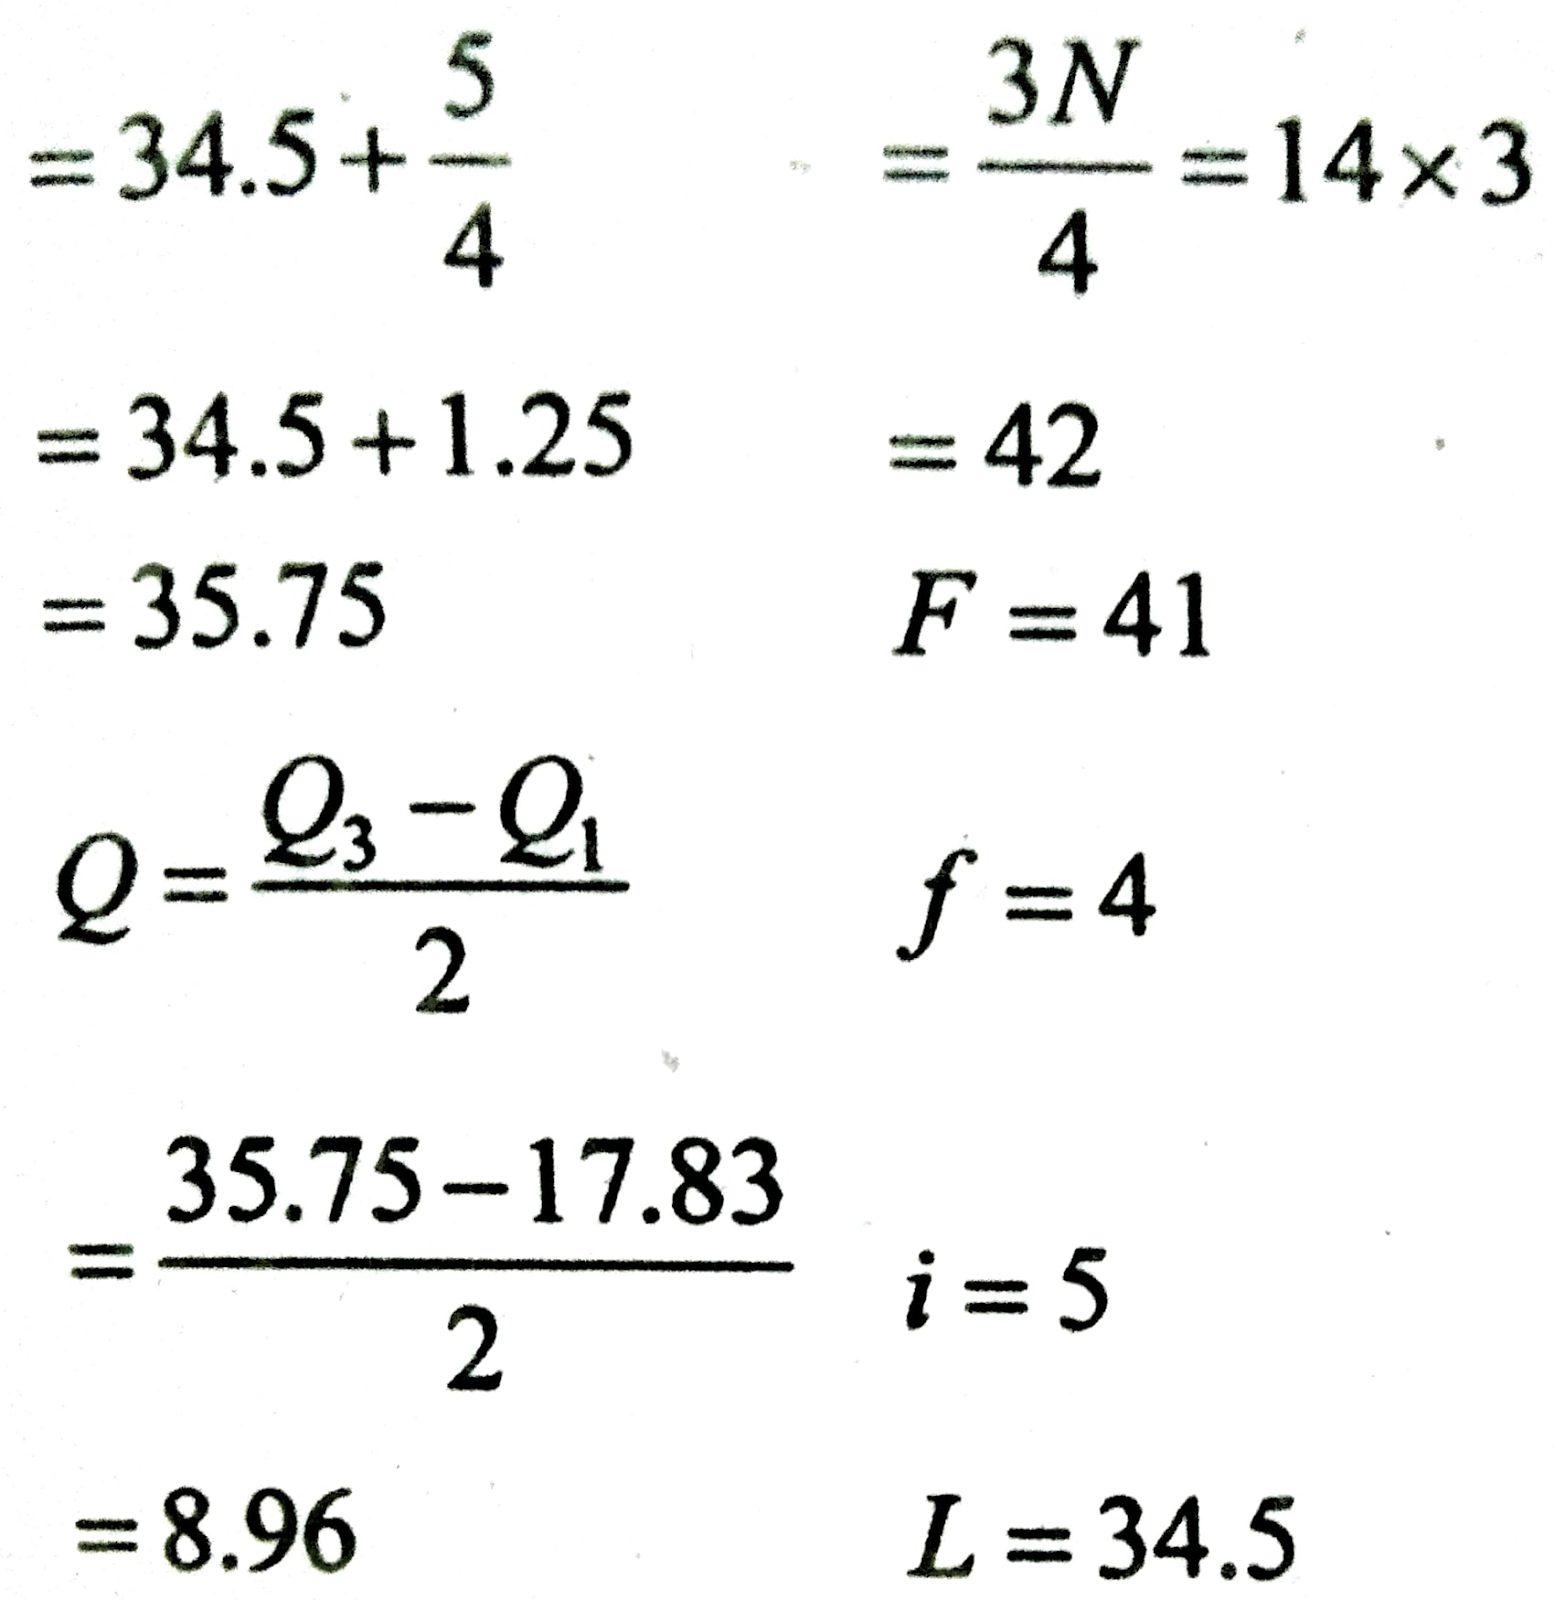
7. What is Quartile Deviation? If 1st quartile is 34.56 and Quartile Deviation is 8.97, find the 3rd Quartile.
Ans: Quartile deviation is the one half distance between the first and third quartile or 25th and 75 the percentile in the frequency distribution. First quartile in a distribution means the point below which 25% of the scores lies i.e. one fourth of the total number of scores which is represented by the symbol Q1. The third quartile in a distribution means the point below which 75% of the scores lies i.e. three fourth of the total number of scores which is represented by Q3.
Quartile deviation is also called semi interquartile or interquartile range. Quartile deviation or Q is computed by the formula.
Q = (Q₃ – Q₁ / 2)
2nd Part: Q₁ = 34.56 f Q = 8.97 Q3 = ?
Q = (Q₃ – Q₁ / 2) ⇒ 8. 97 = (Q₃ – 34.56/2) ⇒ Q₃ 17.94 + 34.56 = 52.50 Q₃ = 52.50
8. Explain how a frequency table is prepared, indicating the choice of the number of classes and the width of a class interval.
Ans: The organisation of data and grouping of scores into the classes or categories is known as frequency distribution. Frequency is stand for the number of times a score has occurred in the test or experiment.
The frequency distribution classifying scores by the following essential steps –
(i) Determining of range.
(ii) Class interval.
(iii) Tally marks.
(iv) Frequencies.
(v) Midpoint of an interval.
With the help of frequency distribution table we can classify the collected data in a systematic manner.
9. Mention the advantages of central tendency.
Ans: The advantages of central tendency are as follows-
(i) It is an average or typical value, which represents all of the scores made by the group as a whole.
(ii) It helps to compare two or more groups in terms of typical performance.
(iii) Measure of central tendency can make representation value of any incident or facts most substantially.
(iv) We can have a distinct idea about collected data or facts by means of measures of central tendency.
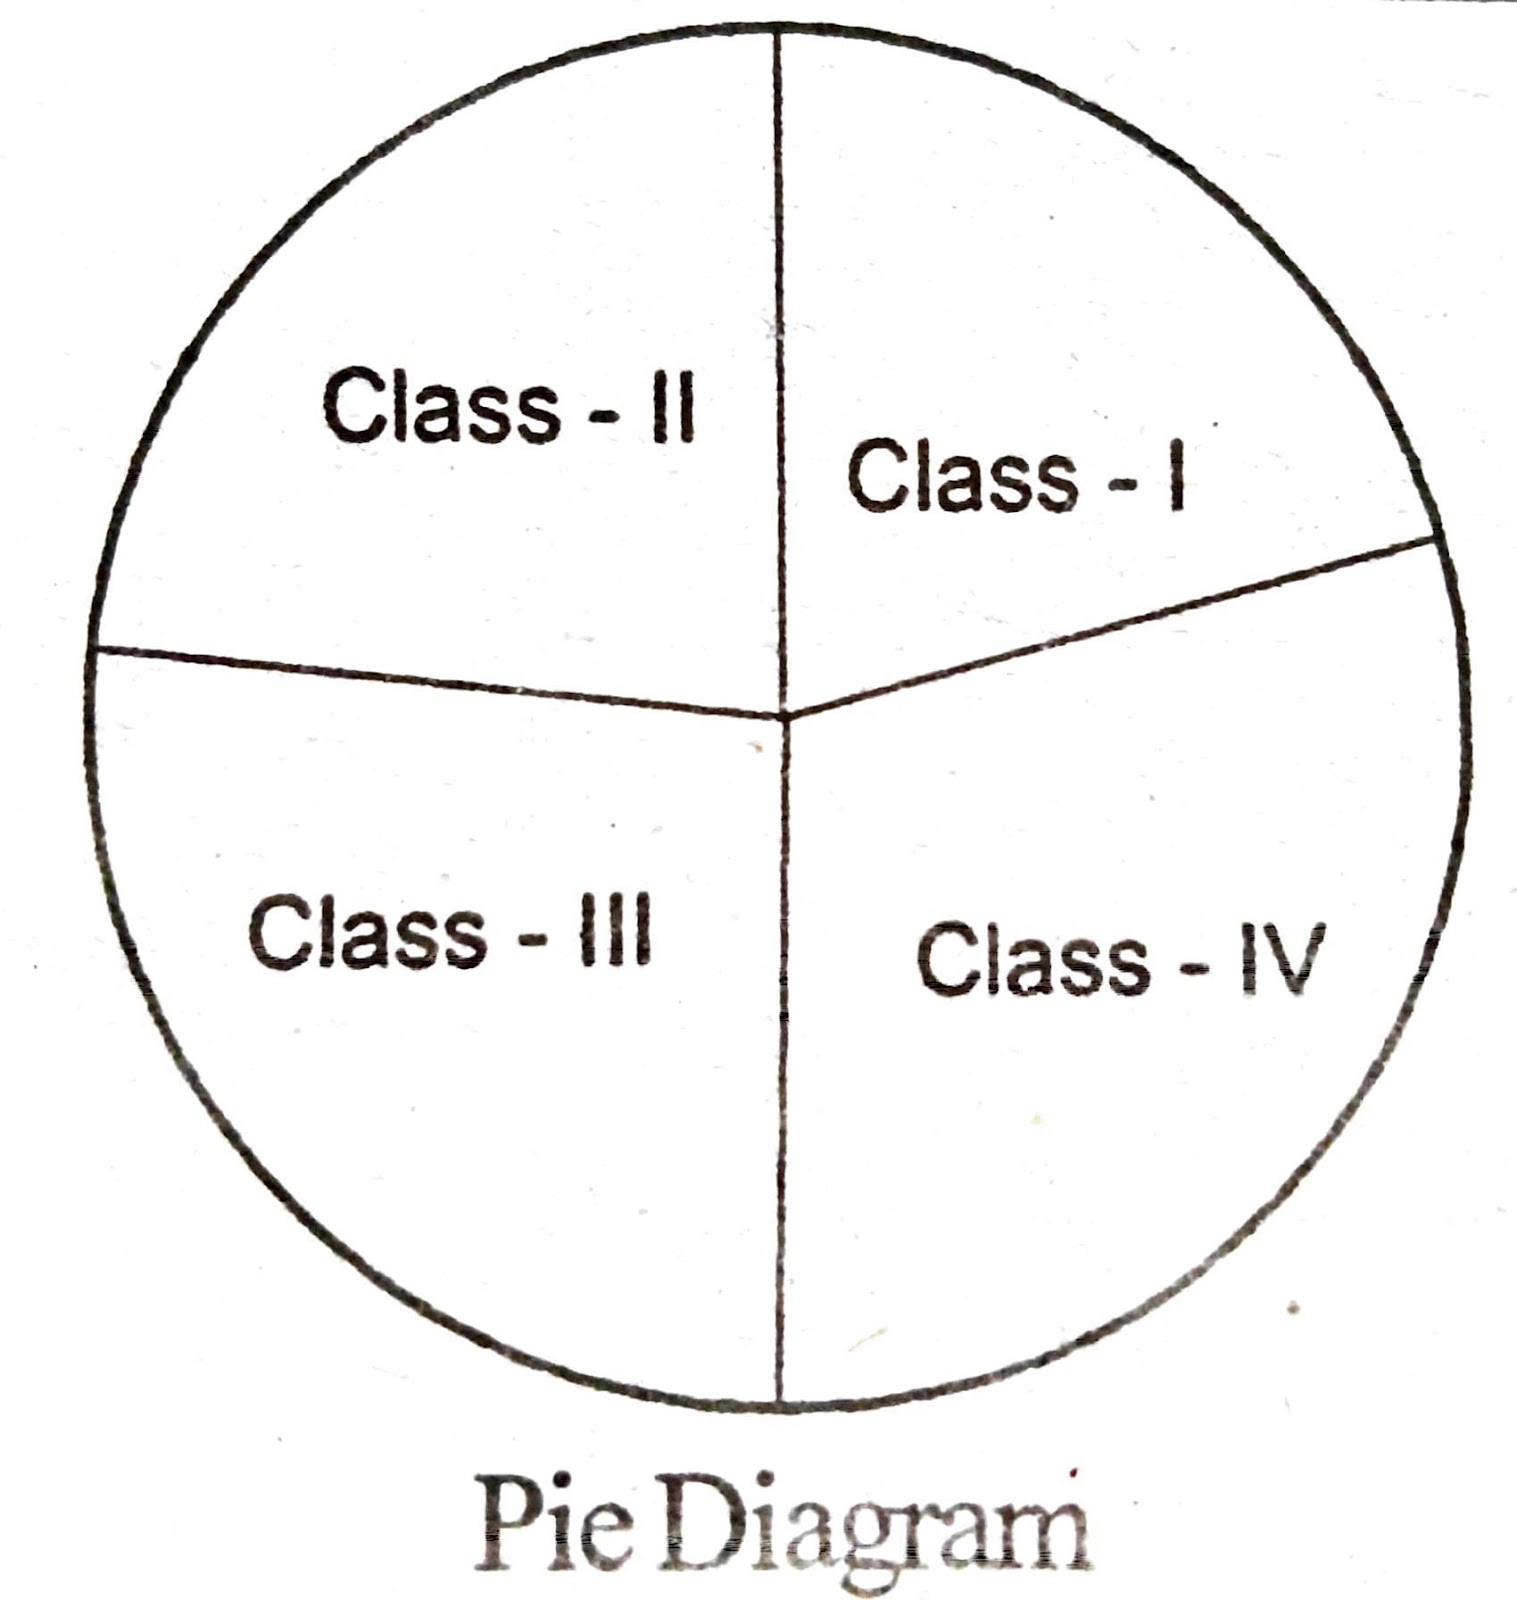
10. Result of a primary school is present below. Draw a pie diagram.
| Class | No. of Students passed |
| Class – I | 45 |
| Class – II | 56 |
| Class – III | 40 |
| Class – IV | 35 |
Ans: We know that, in pie diagram entire circle angle is 360° and it represents 100% but here it is showing as 176.
∴ Angle made for class I = 45 × 360°/176 = 92.05
∴ Angle made for class II = 56 × 360°/176 = 114.54
∴ Angle made for class III = 40 × 360°/176 = 81.82
∴ Angle made for class IV = 35 × 360°/176 = 71.59
Pie diagram is shown as below:
| E. QUESTIONS FOR 5 MARK EACH |
1. Define statistics? Explain the utility of the science in the field of education and Psychology.
Ans: According to Seligman Statistics is the Science which deals with the methods of collecting, classifying, presenting, comparing and interpreting numerical data collected through some light on any sphere of enquiry.
Utility of statistics in education and psychology may be described below:
(i) To measure intelligence, memory etc.: Statistics helps to measure and record the intelligence, memory, thinking, taste, etc. of students and such data when analysed generally render very useful conclusions.
(ii) To construct intelligence test: It also helps in the construction of intelligence tests which are based on the analysis of the past records of the intelligence of the students. The importance of intelligence tests in the field of education and psychology can hardly be exaggerated.
(iii) Determination of the norm: For effective measurement of attainment and other mental abilities of the students determination of the norm as standard of comparison is essential. Without a standard norm comparative study of the mental abilities in terms of the individual scores is not possible. Statistics can only help us to lay down a reliable norm for such study.
(iv) To maintain records: Records are generally maintained in all the educational institutions in respect of income and expenditure, number of students, examination results, etc. Statistical methods are put into use in keeping of such records.
2. What is a frequency distribution? Point out its importance in statistical investigation.
Ans: Frequency distribution table: The table where the raw scores are systematically arranged may be known as ‘Frequency distribution table.’ In a frequency distribution table there are three columns that is class intervals, tally marks and frequencies. The range of the variable in a particular sub-range is called class-interval and the number of items in a class-interval is knows as class frequency. The distribution as class frequency over the class intervals is known as the frequency distribution of the variables.
In order to prepare a frequency distribution table, the following methodical steps must be followed:
(a) To identify the lowest and highest scores of the given number.
(b) Choose the magnitude of class intervals. Fix up the position of intervals.
(c) To give tally marks of the scores in the tally column of the respective class intervals.
(d) To place in figure the tally marks of the respective intervals to show the number of frequencies clearly.
Importance:
(i) It may reduce the size of the scores to make them easily comprehensible.
(ii) The table can show us whether the scores are more inclined towards the upper or lower limit of the distribution whether they are normally distributed.
(ii) The toble can show in which class interval there is the highest or the lowest number of frequency to be found.
(iv) Moreover the total is helpful for making graphic representation of the data by drawing the polygon or histogron.
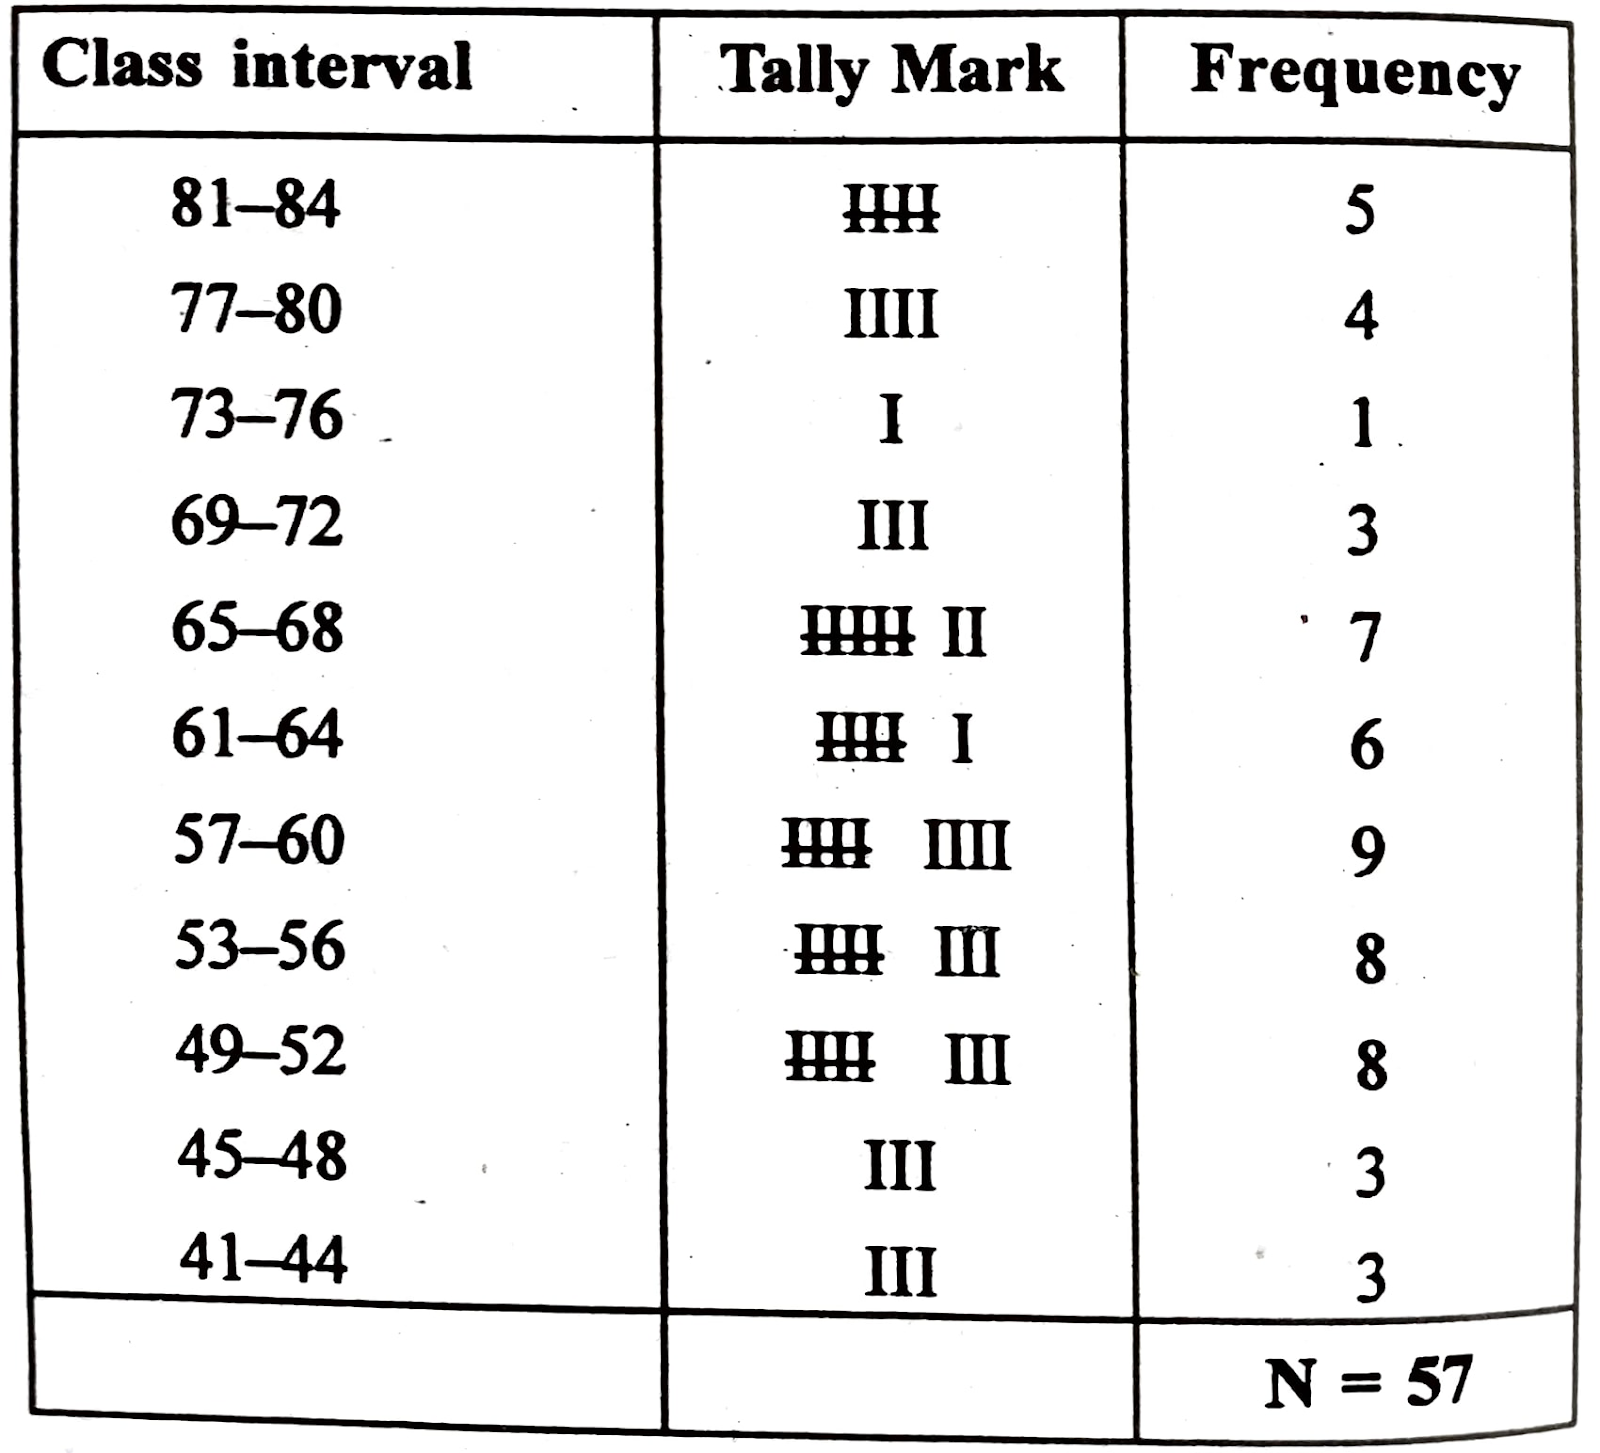
3. The following scores were obtained by a group of students on an achievement tests in mathematics. (5 marks for each question)
60 49 55 48 58 65 63 66 58 58 82 84
49 66 77 54 62 38 52 52 64 82 61 78
72 58 83 67 55 62 77 55 51 59 53 58
41 54 68 72 62 56 74 51 71 60 51 60
70 68 67 48 57 44 55 48 82 77 70 42
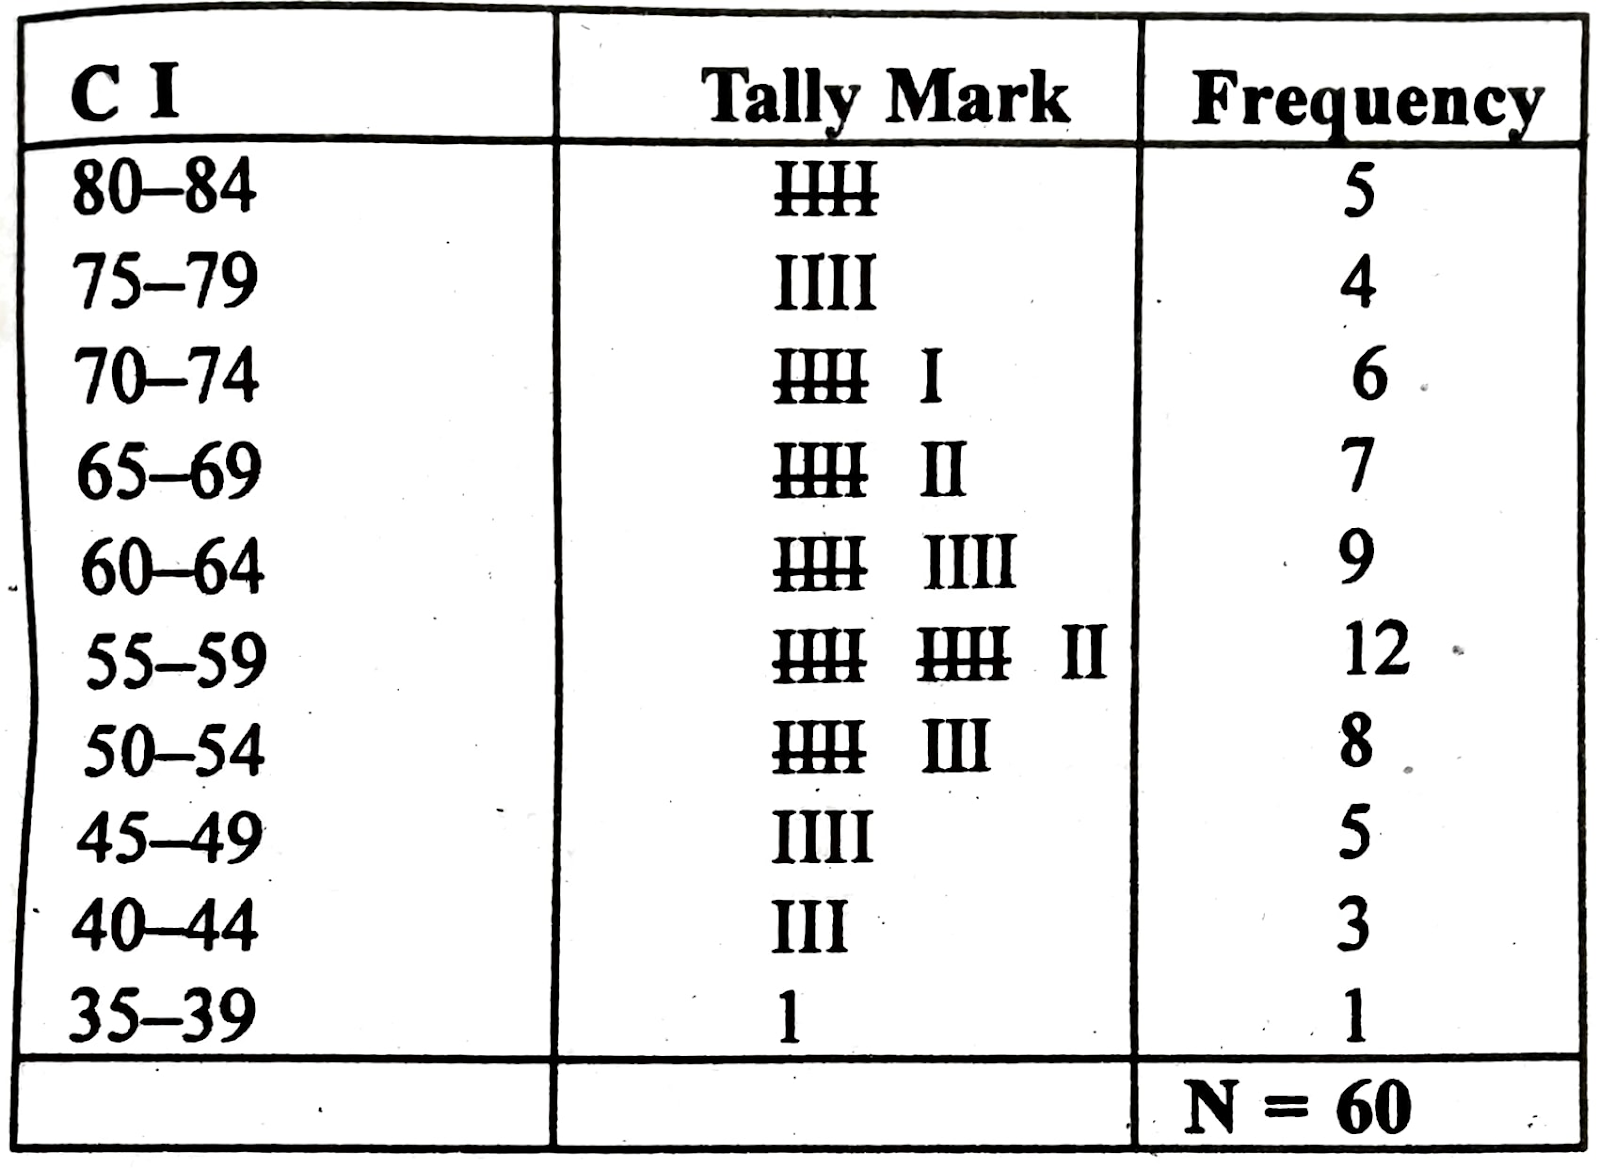
(a) Construct a frequency distribution using class interval 5 and 41 as the score limits of the lowest interval.
(b) Set up a frequency distribution by using a class interval of 5 units.
(c) Construct a frequency, a histogram of the data given in Questi No. 61
(d) Construct a frequency polygon of the data given in Question No. 61
Ans: (a)
(b)
(c)
| CI | Tally Mark | Frequency |
| 80-84 | 5 | 82 |
| 75-79 | 4 | 77 |
| 70-74 | 6 | 72 |
| 65-69 | 7 | 67 |
| 60-64 | 9 | 62 |
| 55-59 | 12 | 57 |
| 50-54 | 8 | 52 |
| 45-49 | 5 | 47 |
| 40-44 | 3 | 42 |
| 35-39 | 1 | 37 |
4. Draw a histogram and frequency polygon on the same axis of following data and discuss the relative advantages of these two methods of representation of data. (8 marks)
| Score | F | Mid Points (X) |
| 59-54 | 1 | |
| 45-49 | 7 | |
| 40-44 | 3 | |
| 35-39 | 4 | |
| 30-34 | 6 | |
| 25-29 | 7 | |
| 20-24 | 12 | |
| 15-19 | 6 | |
| 10-14 | 8 | |
| 5-9 | 2 |
What are the different measures of central tendency? What are their advantages?
Ans:
| Score | F | Mid Points (X) |
| 59-54 | 1 | 52 |
| 45-49 | 7 | 47 |
| 40-44 | 3 | 42 |
| 35-39 | 4 | 37 |
| 30-34 | 6 | 32 |
| 25-29 | 7 | 27 |
| 20-24 | 12 | 22 |
| 15-19 | 6 | 17 |
| 10-14 | 8 | 12 |
| 5-9 | 2 | 7 |
POLYGON, HISTOGRAM.
5. The Mean of a group of scores is 35. When the mean would be if the score were first altered by each of the following methods:
(a) 15 points are added to each score.
(b) 10 points are subtracted from each score.
(c) Each score is multiplied by 5.
(d) Each score is divided by 4.
(e) 10 points are added to each score.
Ans: Properties of Mean:
(i) It is used when we wish to know the representative value of the scores.
(ii) It may be used when the greatest sampling stability is wanted.
(iii) It is useable when the distribution of the scores is normal or symmetrical.
Properties of median:
(i) It can be used when we do not have sufficient time to compute the mean.
(ii) It can be used when the scores are abnormally distributed or marked skewed
(iii) It is used when the midpoint of the distribution i.e. 50% is wanted.
(iv) It many be used when there is gap in the distribution of the frequency.
Properties of mode:
(i) It is used when rouh estimate of central tendency may serve the purpose.
(ii) It is helpful when we must to know the most typical case arising out of the distribution.
(iii) It appears best to represent the group.
6. Calculate the mean by long method from the following table
| Class Interval | Frequencies |
| 78-79 | 3 |
| 76-77 | 5 |
| 74-75 | 6 |
| 72-73 | 8 |
| 71-70 | 7 |
| 68-69 | 14 |
| 66-67 | 11 |
| 64-65 | 2 |
| 62-63 | 5 |
| 60-61 | 4 |
Ans: (a) Mean = 35
15 points is added.
∴ 35 + 15 = 50
50 + 50 + 50 + 50 + 50/5 = 250/5 = 50.
(b) 10 points is substracted.
35 – 10 = 25
25 + 25 + 25 + 25 + 25/5 = 25
(c) Each score is multiplied by 5.
35 × 5 = 175
175 + 175 + 175 + 175 + 175/5 = 175
(d) Each score is divided by 4
35 ÷ 4 = 8.75
8.75 + 8.75 + 8.75 + 8.75 + 8.75/5 = 8.75
(e) 10 points are added.
35 + 10 45 = 45 + 45 + 45 + 45 + 45/5 = 45
7. Calculate the mean marks of 30 students given in the following distribution by ‘Assumed mean’ method and also determine the Median of the distribution. (8 marks)
| Class interval | 33-36 | 29-32 | 25-28 | 21-24 | 17-20 | 13-16 | 9-12 | 5-8 | 1-4 |
| F | 1 | 1 | 4 | 10 | 5 | 3 | 3 | 2 | 1 |
Ans:
| C.I. | Frequency | X | fx |
| 78-79 | 3 | 78.5 | 235.5 |
| 76-77 | 5 | 76.5 | 282.5 |
| 74-75 | 6 | 74.5 | 447 |
| 72-73 | 8 | 72.5 | 580 |
| 71-70 | 7 | 71.5 | 500.5 |
| 68-69 | 14 | 68.5 | 959 |
| 66-67 | 11 | 66.6 | 731.5 |
| 64-65 | 2 | 66.5 | 129 |
| 62-63 | 5 | 62.5 | 312.5 |
| 60-61 | 4 | 60.5 | 242 |
| N = 65 | Σfx = 4519.5 |
Mean (M)= AM + Σfx’ / N ×i = 22.5 + 12/30 × 4 = 22.5 + 48/30 = 22.5 + 16
Mean = 388.5
Median = N + 1/2 = 30 + 1/2 = 15.5
8. What is meant by variability of scores and what are its measures? Discuss the uses of range.
Ans:
| CI | f | x | fx |
| 150-154 | 4 | 152 | 680 |
| 145-149 | 8 | 147 | 1176 |
| 140-149 | 10 | 142 | 1420 |
| 135-139 | 12 | 137 | 1644 |
| 130-134 | 2 | 132 | 264 |
| 125-129 | 10 | 127 | 1270 |
| 120-124 | 7 | 122 | 854 |
| 115-119 | 8 | 117 | 936 |
| 110-114 | 5 | 112 | 560 |
| N = 66 | Σfx = 8732 |
Mean = Σfx/N = 8732/66 = 132.30
Median = N + 1/2 = 66+1/2 = 67/2 = 33.5
9. What is quartile deviation? Discuss the uses of quartile deviation as measures variability.
Ans: Quartiles are those 3 values of the distribution which divides the whole distribution into 4 equal parts.
The Quartile deviation (Q) is one half the scale distance between the 75th and the 25th percentile in a frequency distribution. The 25th percentile or Q₁ called the first quartile is the point below which lie 25% of the scores. The 75th percentile or 3 called the third quartile is the point below which lie 75 percent of the scores.
The formula of finding out – Q ₃ = 3/1 (Q ₃- Q₁)
In order to find out Q, we must calculate Q1 or the 25th (P25) and Q₃ or the 75th (P75) percentiles. These values found exactly by the same method employed in calculating the medium formula being-
Q ₃ = L+ (3N/4-fb)/fb × i
Q₁ = L+ ( N/4-fb)/fb × i
Then Q. D is computed by applying the formula – Q = Q ₃ – Q₁ /2
Here, L = The lower limit of the class interval where N/4 or 3N/4 value falls.
N = The sum of all the frequencies
fb =The Cumerlative frequency of all the class intervals below the class interval where N/4 as 3N/4 value falls.
i = The span of all the class intervals.
fp = Particular frequency of class interval where N/4 as 3N/4 falls.
Uses:
(i) It help to ascertain the degree of variabilty or deviation or dispersion of the data.
(ii) It makes possible comparing between different groups.
(iii) It is very important in comparing the remedies of many social problems of defferent area.
(iv) It serve as a useful check on drawing conclusions from the comparison of averages or measures of central tendency.
(v) They are of great value in the statistical analysis of the data.
10. Explain the properties of range and quartile deviation as measures variability.
Ans: Properties of range:
(i) When the data are too scanty or too scattered to justify the computation of a more precise measure of variability range is used.
(ii) Range is used when a knowledge of extreme scores of total spread is all that is wanted.
(iii) It is used for rough and quick comparison.
11. Discuss their relative importance of range and quartile deviation as measures variability.
Ans: Properties of quatile deviation: Quortile deviation may be defined as one-half the scale distance between the 75th and 25th percentiles in the frequency distribution. The 25th percentile of distribution of scores in the first quartile or Q₁ and the 75th percentile is the third quarter or Q₃. The 50th percentile of distribution is popularly know as or the median. The difference between the third and the first quartile value is the inter-quartile difference. This difference when divided by 2, we get the quartile deviation.
The formula representing the concept is:
Q = Q ₃- Q₁/2
(i) When the median is the measure of centre frequency.
(ii) When there are scattered or extreme scores which would influence the standard deviation (SD) disproportionality.
(iii) When the concentration around the mean the middle 50% of cases is of primary interest.
(iv) When the distribution is incomplete at either end.
12. Calculate the Quartile deviation for the following distribution of scores.
Class interval
| 50-54 | 45-49 | 40-44 | 35-39 | 30-34 | 25-29 | 20-24 | 15-19 | 10-14 | 5-9 |
Frequency
| 1 | 7 | 3 | 4 | 6 | 7 | 12 | 6 | 8 | 2 |
Ans:
| Class interval | frequencies | Deviation frequencies |
| 50-54 | 1 | 56 |
| 44-49 | 7 | 55 |
| 40-44 | 3 | 48 |
| 35-39 | 4 | 45 Q3 |
| 30-34 | 6 | 41 |
| 25-29 | 7 | 35 |
| 20-24 | 12 | 28 |
| 15-19 | 6 | 16 Q1 |
| 10-14 | 8 | 10 |
| 5-9 | 2 | 2 |
| N = 56 |
13. Calculate the mean by long method from the following table:
Class interval
| 78-79 | 76-77 | 74-75 | 73-72 | 71-70 | 68-69 | 66-67 | 64-65 | 62-63 | 60-61 |
Frequencies
| 3 | 5 | 6 | 8 | 7 | 14 | 11 | 2 | 5 | 4 |
Ans: The formula of mean by long method is M = Σfx/N
Computing Mean by long method:
| Class interval | Frequency | x Middle point | f.x. |
| 78-79 | 3 | 78.5 | 235.5 |
| 76-77 | 5 | 76.5 | 382.5 |
| 74-72 | 6 | 74.5 | 447.0 |
| 73-72 | 8 | 73.5 | 588.0 |
| 71-70 | 7 | 71.5 | 500.5 |
| 68-69 | 14 | 68.5 | 959.0 |
| 66-67 | 11 | 66.5 | 731.5 |
| 64-65 | 2 | 64.5 | 129.0 |
| 62-63 | 5 | 62.5 | 312.5 |
| 60-61 | 4 | 60.5 | 241.0 |
| N = 65 | Σfx = 4527.5 |
∴ M = Σfx/N [Σfx = 4527.5, N = 65] = 4527.5/65 = 69.65
Mean = 69.65
14. Represent the following data of students enrollment in a primary school by pie digram
| Class | No. of students |
| I | 40 |
| II | 56 |
| III | 50 |
| IV | 45 |
Ans: Calculation of pie digram:
| Class | No. of students | Degree |
| I | 40 | 40/191 × 360° = 75.39 |
| II | 56 | 56/191 × 360° = 105.55 |
| III | 50 | 50/191 × 360° = 94.24 |
| IV | 45 | 45/191 × 360° = 84.82 |
| 191 | 360° |
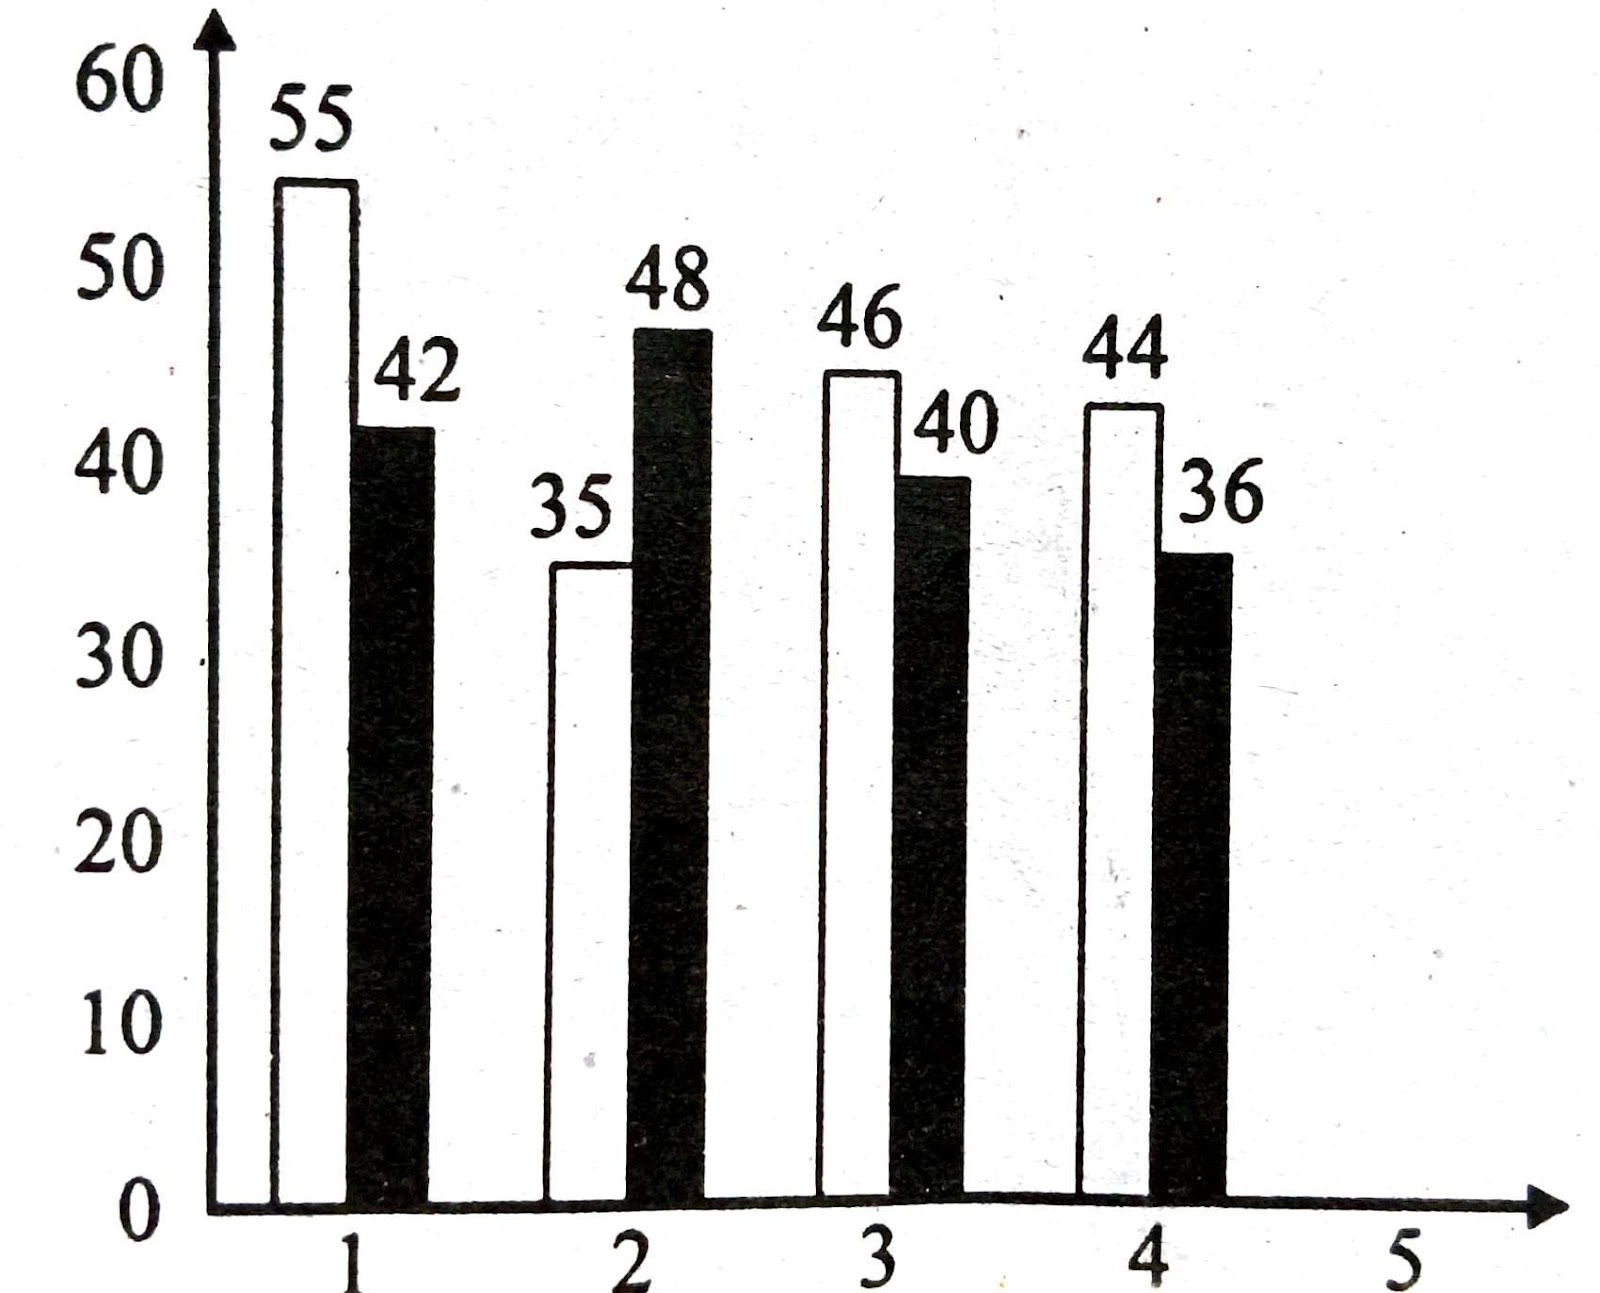
15. Represent the following data of students, enrollment in a primary school by bar diagram. (Use graph paper).
| Class | Boys | Girls |
| Class – I | 55 | 42 |
| Class – II | 35 | 48 |
| Class – III | 46 | 40 |
| Class – IV | 44 | 36 |
Ans:
16. Draw a comparative study of the properties of Mean, Median and Mode as measures of central tendency.
Ans: A comparative study of the properties of Mean, Median and Mode as measures of central tendency are as follows:
(i) To know the representative value of scores, uses mean.
When exact mid point of the distribution is required then uses of Median.
When a quick and appropriate measure of central tendency is required then used mode.
(ii) When the distribution of the scores is normal, natural and equitable mean is used.
When the scores are markedly skewed or abnormally distributed then median is used.
When the most often recurring score is sought then mode is used.

Hi! I’m Ankit Roy, a full time blogger, digital marketer and Founder of Roy Library. I shall provide you all kinds of study materials, including Notes, Suggestions, Biographies and everything you need.
